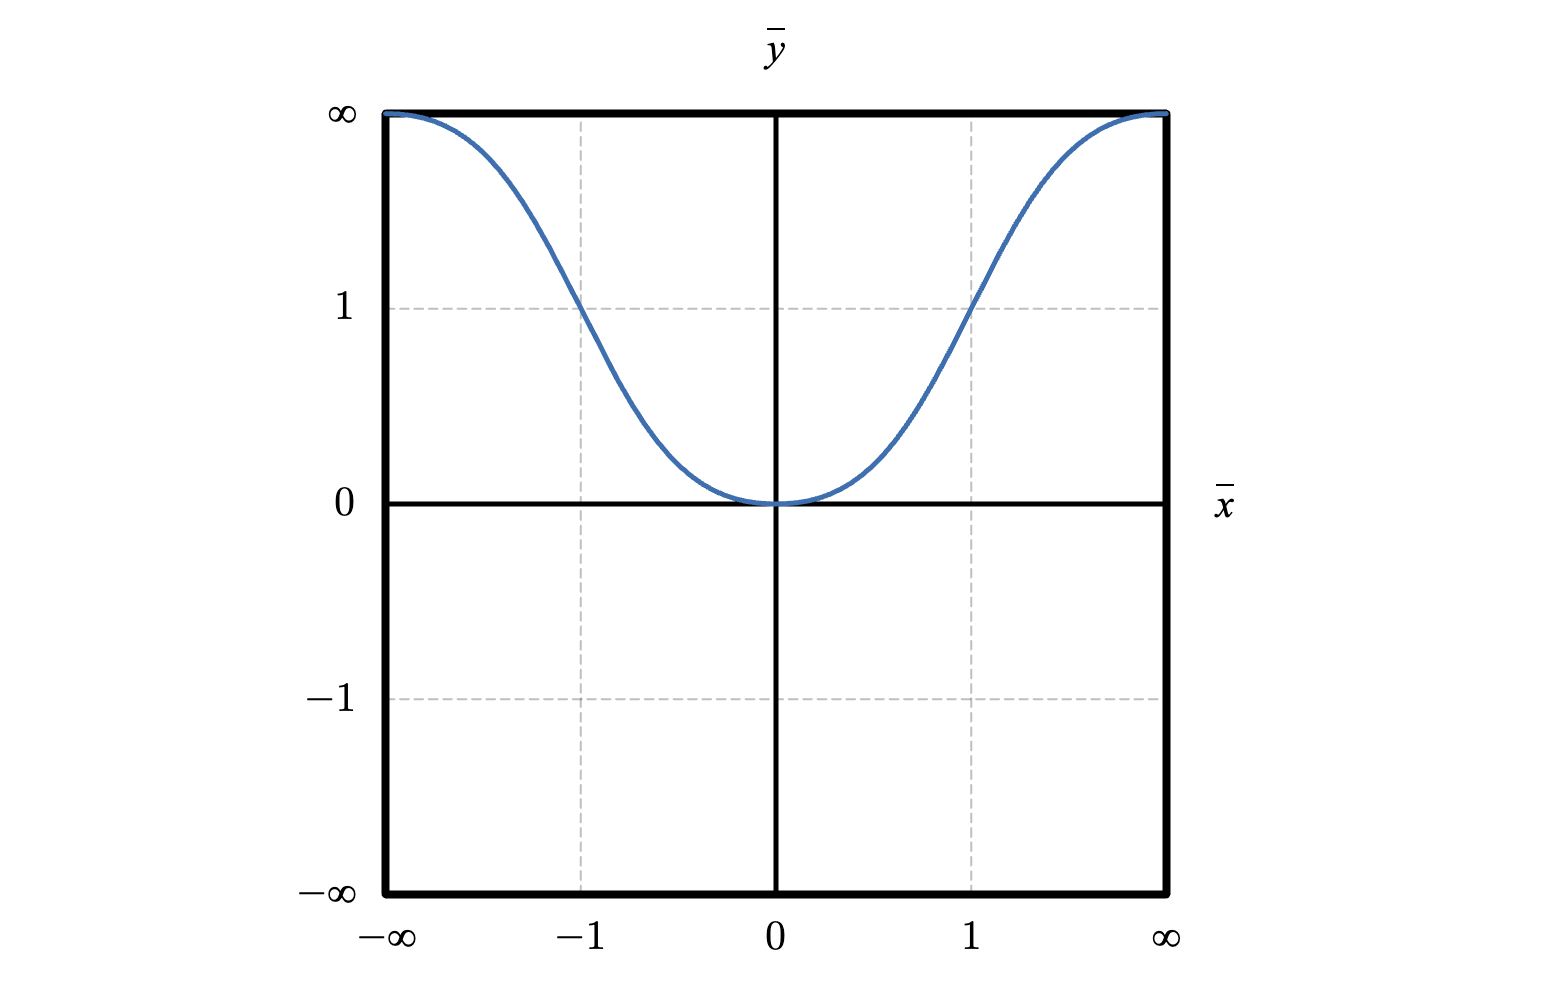
Description: Starting with the current surnames ranking (in the US), it simulates how they would evolve over time. Each simulation throws different results.
How it works:
It starts with a population of 1000 people where the number of people with a certain surname is proportional to reality based on the top-200 surnames in the ranking.
Every member of the population has gender, age, and a surname.
For every year passed, every person gets one year older.
People ranging 15 through 35 years old are in the "mating" period, and they may find a partner of the opposite sex and get married. Couples may have kids assuming the more kids they have the less probable they continue to have kids. The family surname will be passed down to the kids.
Every person has a chance of dying which is based on real death rate data by age.
The simulation ends when, either:
One surname takes over all, or
No surnames get extinct in 1000 years.
Conclusion: No matter how many surnames there are, if it always is the father's (or always the mother's) surname the one which gets passed down it will always come a day when only one surname remains.
Description: Launch the app, write a function f(x) under "Function to depict" and see how it would look like in a confined space.
Motivation: When represented on R2 we never see the actual behavior of function graphs outside the axes limits. They can never be represented in their totality. The idea behind the fenced representation of functions is to compress and confine whole graphs of functions inside a limited space so that we can see their full behavior without bounds. All the function information in a finite space.
How it works:
You input a real function formula on the variable x and the app generates a graph for that function on the Cartesian plane (left) and a graph where the domain and the image of the function have been shrunk to (−1,1)×(−1,1) (right). This restricted space to represent fenced functions is called horogram.
Parabola x2 on the left and its fenced representation on the right.
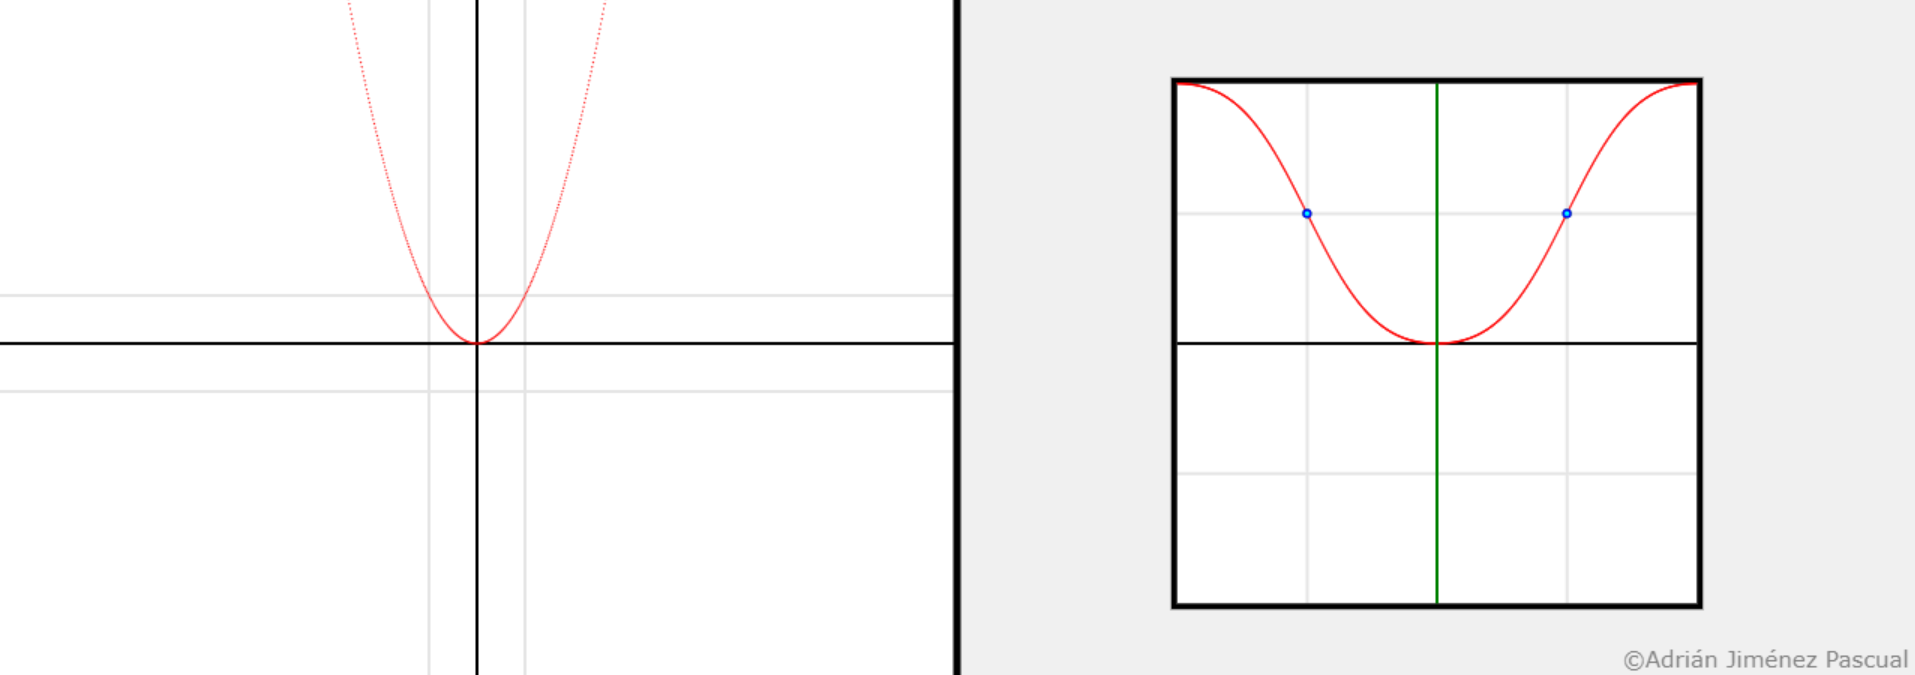
The shrinkage is done through this formula:
τ:R→(−1,1)τ(x)=x1+∣x∣
Note that ±∞ get mapped to ±1, ±1 get mapped to ±12 and 0 is mapped to 0.
You can calculate the symmetries of the fenced function by checking "Symmetries". Green lines will mean "symmetry axis", green points will mean "symmetry about a point", and blue points will be marked for "branch symmetry about a point"—local symmetry of just a branch of the graph, not the whole graph.
The parabola x2 has one axial symmetry and two branch symmetrie about a point.
By checking "Metafunction" you can see how the fenced function would look like if unfenced. Furthermore, on the right side you will see the fenced version of it was it considered as the input function.
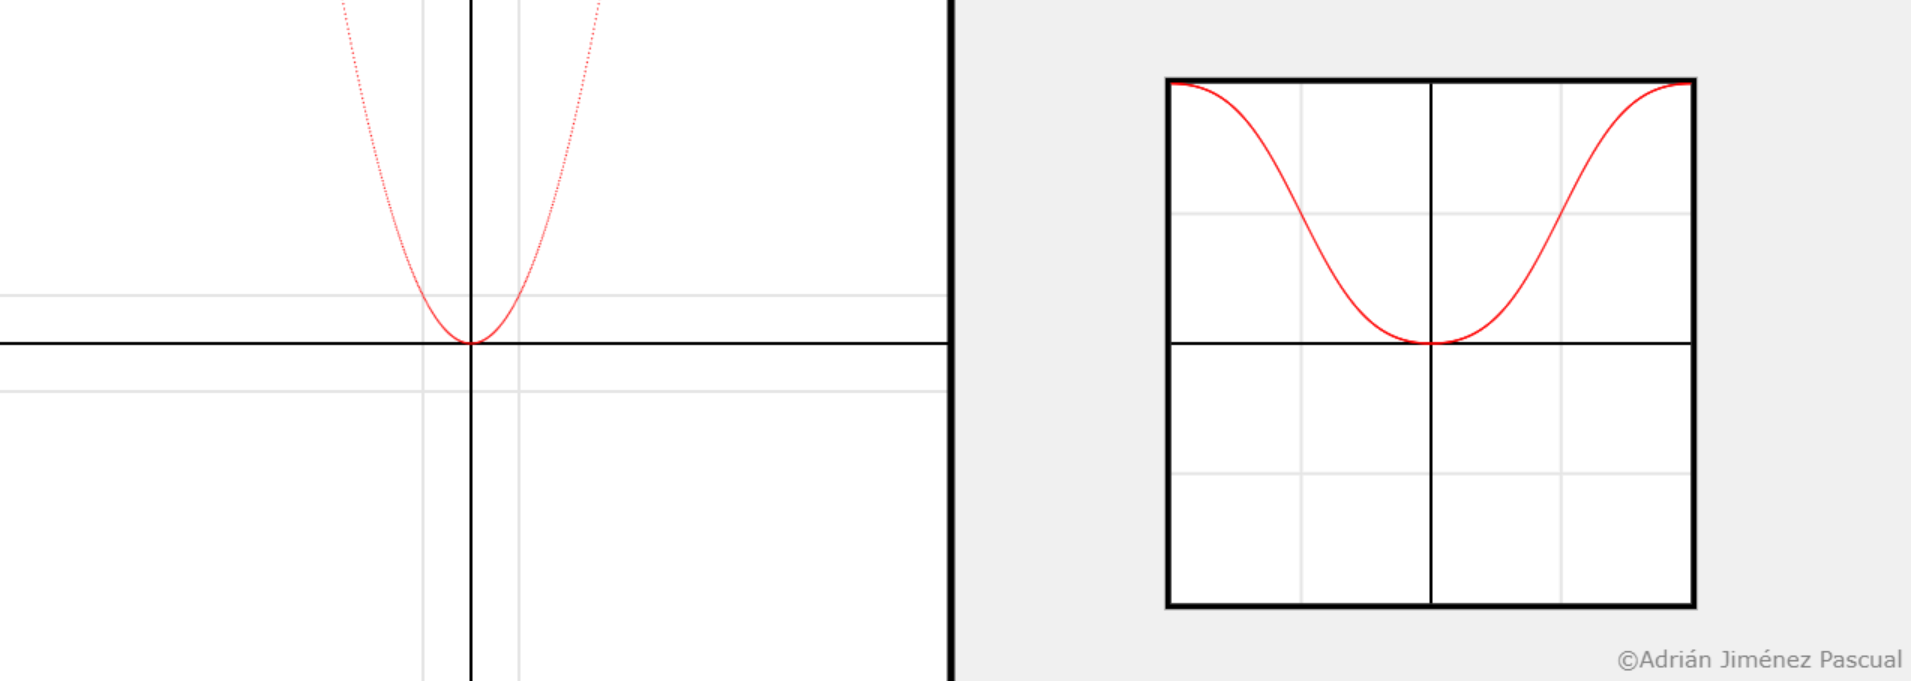
Left: Fenced representation of the parabola x2 interpreted as the input function. Right: Fenced representation of it.